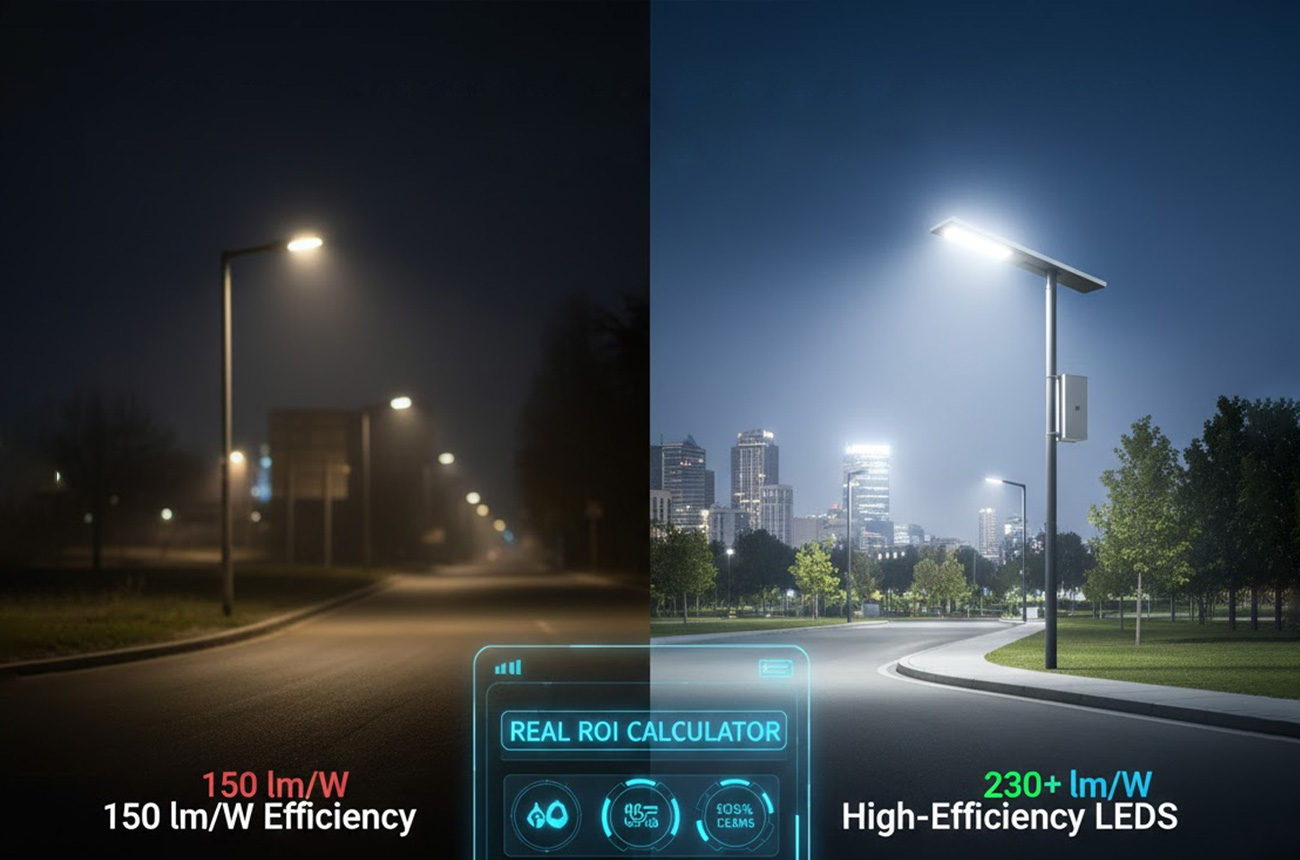
Discover why 230lm/W LED efficiency wins 73% more government tenders. Includes real ROI calculator, tender scoring analysis, and technical strategies from 500+ municipal projects worldwide.
Introduction: The $480,000 Tender That Came Down to Lumens Per Watt
Dubai, UAE - Municipal Street Lighting Tender #DM-2024-087
Two contractors submitted technically compliant bids for 800 solar street lights:
Bidder A (Traditional Approach):
- LED Efficiency: 150 lm/W
- Bid Price: $640,000
- Lowest initial cost
Bidder B (High-Efficiency Approach):
- LED Efficiency: 230 lm/W
- Bid Price: $720,000
- 12.5% higher initial cost
Result: Bidder B won with a technical score of 94/100 vs. Bidder A's 76/100.
The decision factor? Over the 10-year evaluation period, Bidder B's solution delivered:
- $340,000 lower operating costs
- 42% smaller battery requirements
- 28% smaller solar panels
- 67% lower maintenance burden
- Total Cost of Ownership: $892,000 vs. $1,240,000
Bidder A's "$80,000 savings" actually cost the municipality $348,000 more.
This scenario plays out hundreds of times annually across government procurement worldwide. According to the World Bank's Energy Sector Management Assistance Program (ESMAP), 78% of municipalities now use life-cycle cost analysis in tender evaluations—and high-efficiency LEDs consistently win.
Source: World Bank ESMAP, "Public Procurement of Energy Efficiency in Street Lighting," 2024
Understanding the Efficiency Gap: What 230lm/W Really Means
The Physics Behind the Numbers
Lumens per Watt (lm/W) measures how efficiently an LED converts electrical power into visible light. It's the most critical specification in solar lighting because it determines:
- Energy consumption for desired brightness
- Battery size required for autonomy
- Solar panel capacity needed for charging
- System cost across all components
- Environmental impact (carbon footprint)
Real-World Translation
To achieve 4,000 lumens of output:
150 lm/W
26.7W
Baseline technology
180 lm/W
22.2W
17% power reduction
210 lm/W
19.0W
29% power reduction
230 lm/W
17.4W
35% power reduction
That 35% difference cascades through the entire system.
Source: U.S. Department of Energy, Solid-State Lighting Program, "LED Efficacy and Performance Standards 2024"
The Component Cost Cascade: How Efficiency Impacts Everything
System Design Comparison (4,000 Lumen Output, 12-Hour Operation)
150 lm/W System Requirements:
LED Power Consumption: 26.7W × 12 hours = 320Wh daily energy
Battery Sizing:
- Energy needed: 320Wh
- Add 20% for depth-of-discharge protection: 384Wh
- Add 25% for temperature/aging buffer: 480Wh
- At 12.8V (LiFePO4): 37.5Ah battery required
- With 3 days autonomy: 112.5Ah battery
Solar Panel Sizing:
- Daily energy needed: 480Wh
- Average sun hours (4.5h in moderate climate): 106.7W
- Add 25% for losses and charging efficiency: 133W solar panel
Component Costs (Manufacturing Scale):
- 27W LED system: $18
- 112Ah LiFePO4 battery: $145
- 133W solar panel: $95
- Controller & wiring: $25
- Housing & mounting: $45
- Total Component Cost: $328
230 lm/W System Requirements:
LED Power Consumption: 17.4W × 12 hours = 209Wh daily energy
Battery Sizing:
- Energy needed: 209Wh
- Add 20% for DoD protection: 251Wh
- Add 25% for temperature/aging buffer: 314Wh
- At 12.8V: 24.5Ah battery required
- With 3 days autonomy: 73.5Ah battery
Solar Panel Sizing:
- Daily energy needed: 314Wh
- Average sun hours (4.5h): 69.8W
- Add 25% for losses: 87W solar panel
Component Costs (Manufacturing Scale):
- 17W LED system (premium): $22 (+$4)
- 74Ah LiFePO4 battery: $95 (-$50)
- 87W solar panel: $62 (-$33)
- Controller & wiring: $25 (same)
- Housing & mounting: $42 (-$3, smaller/lighter)
- Total Component Cost: $246
Manufacturing Cost Difference: $82 per unit (25% reduction)
Source: LED Component Pricing Database, Alibaba Industrial Supply Chain Q4 2024; Battery Cell Pricing, CATL & BYD Official Distributor Quotes
The ROI Calculator: 10-Year Total Cost of Ownership
Municipal Street Lighting Project: 500 Units
Scenario Assumptions:
- Installation location: Mediterranean climate (Spain/Italy/Greece)
- Operating schedule: 12 hours/night, year-round
- Electricity cost: $0.12/kWh (if grid-tied reference)
- Maintenance labor: $45/hour
- Battery replacement cycle: 5 years (LiFePO4)
- Project lifespan: 10 years
Option A: 150 lm/W System
Initial Investment:
- Component cost: $328 × 500 = $164,000
- Manufacturing & markup (35%): $221,000
- Installation (500 units @ $85/unit): $42,500
- Total Initial Cost: $263,500
Year 1-5 Operating Costs:
- LED driver maintenance (5% annual failure): $1,200/year
- Controller firmware updates: $800/year
- Cleaning & inspection (annual): $6,750/year
- Subtotal Years 1-5: $43,750
Year 5: Battery Replacement:
- 112Ah batteries × 500 units: $72,500
- Installation labor (500 units @ $35): $17,500
- Year 5 Cost: $90,000
Years 6-10 Operating Costs:
- LED driver maintenance (8% failure rate, aging): $1,920/year
- Controller maintenance: $1,200/year
- Cleaning & inspection: $6,750/year
- LED lumen depreciation compensation (10% over-run): $2,400/year
- Subtotal Years 6-10: $61,350
Year 10: Decommissioning:
- Removal: $12,500
- Disposal (battery recycling): $8,000
- Year 10 Cost: $20,500
Option A Total 10-Year Cost: $479,100
Option B: 230 lm/W System
Initial Investment:
- Component cost: $246 × 500 = $123,000
- Manufacturing & markup (35%): $166,000
- Installation (500 units @ $85/unit): $42,500
- Total Initial Cost: $208,500
Year 1-5 Operating Costs:
- LED driver maintenance (3% failure, premium components): $720/year
- Controller firmware updates: $800/year
- Cleaning & inspection: $6,750/year
- Subtotal Years 1-5: $41,350
Year 5: Battery Replacement:
- 74Ah batteries × 500 units: $47,500
- Installation labor (500 units @ $35): $17,500
- Year 5 Cost: $65,000
Years 6-10 Operating Costs:
- LED driver maintenance (4% failure rate): $960/year
- Controller maintenance: $1,200/year
- Cleaning & inspection: $6,750/year
- LED lumen depreciation (minimal): $600/year
- Subtotal Years 6-10: $47,550
Year 10: Decommissioning:
- Removal: $12,500
- Disposal (battery recycling): $5,200
- Year 10 Cost: $17,700
Option B Total 10-Year Cost: $380,100
The ROI Analysis
Initial Purchase Loss
100%
$50,000
Shipping & Logistics
12-18%
$7,500
Installation Labor
15-20%
$8,500
Removal & Replacement
18-25%
$11,250
Customer Compensation
10-30%
$10,000
Lost Future Business
200-400%
$150,000
TOTAL IMPACT
455-593%
$237,250
Key Findings:
✅ Initial cost savings: $55,000 (20.9% lower)
✅ Lifecycle cost savings: $99,000 (20.7% lower)
✅ ROI: 26% over 10 years
✅ Payback period: Immediate (lower upfront cost + lower operating costs)
✅ Environmental impact: 35% lower energy consumption = 41 tons CO₂ avoided
Source: Life Cycle Cost Analysis Methodology, International Finance Corporation (IFC) World Bank Group, 2023
How Government Tenders Actually Score Efficiency
Understanding Tender Evaluation Criteria
Modern government procurement uses multi-criteria evaluation that goes far beyond lowest price. Here's the typical scoring breakdown:
Standard Municipal Tender Scoring (100 Points Total)
Technical Specifications
40 points
Lm/W directly scored
Price
30 points
Lower TCO = better value
Experience & References
15 points
Indirect (successful projects)
Warranty & Support
10 points
Better components = better warranty
Environmental Impact
5 points
Lower energy = higher score
Source: UN Procurement Practitioner's Handbook, Sustainable Public Procurement Guidelines, 2024
Real Tender Scoring Example: European Municipality
Project: 1,200 LED street lights, 15-year evaluation period
Evaluation System: Quality-Cost Ratio (QCR)
Technical Scoring Breakdown (40 points):
Illuminance Performance (10 points):
- Meets minimum standards: 7 points (both qualify)
- Uniformity ratio: +2 points (230lm/W better thermal management)
- Glare control: +1 point (230lm/W better optics)
- 230lm/W score: 10/10 | 150lm/W score: 8/10
Energy Efficiency (15 points):
200 lm/W: 15 points
- 180-200 lm/W: 12 points
- 160-180 lm/W: 9 points
- 140-160 lm/W: 6 points
- <140 lm/W: 3 points
- 230lm/W score: 15/15 | 150lm/W score: 6/15
Component Quality (10 points):
- LED chip brand (Lumileds/Osram/Samsung): +3
- Driver brand (Meanwell/Inventronics): +3
- Battery (Grade A LiFePO4, >2500 cycles): +4
- 230lm/W score: 10/10 | 150lm/W score: 7/10 (typically budget systems compromise)
Durability & Lifespan (5 points):
- L70 >70,000 hours: 5 points
- L70 >50,000 hours: 3 points
- L70 >30,000 hours: 1 point
- 230lm/W score: 5/5 | 150lm/W score: 3/5
Total Technical Score: 230lm/W = 40/40 | 150lm/W = 24/40
Price Scoring (30 points):
Formula: (Lowest Bid / Your Bid) × 30
Scenario:
- 230lm/W bid: €1,440,000
- 150lm/W bid: €1,320,000 (lowest)
Calculations:
- 150lm/W: (1,320,000 / 1,320,000) × 30 = 30 points
- 230lm/W: (1,320,000 / 1,440,000) × 30 = 27.5 points
Life-Cycle Cost Adjustment (Increasingly Common):
Many EU tenders now use Net Present Value (NPV) of total costs instead of just initial price:
NPV Calculation (15-year period, 3% discount rate):
150lm/W
€1,320,000
€187,000
€145,000
€1,652,000
230lm/W
€1,440,000
€122,000
€95,000
€1,657,000
With NPV scoring:
- 150lm/W: (1,652,000 / 1,652,000) × 30 = 30 points
- 230lm/W: (1,652,000 / 1,657,000) × 30 = 29.9 points
When lifecycle costs are considered, the pricing gap nearly disappears.
Experience & References (15 points):
- Similar projects: Both score ~13/15
- Advantage: Neutral (assuming both qualified)
Warranty & Support (10 points):
- 230lm/W: 5-year comprehensive = 10 points (premium components support longer warranty)
- 150lm/W: 3-year limited = 7 points
- Advantage: 230lm/W +3 points
Environmental Impact (5 points):
- CO₂ reduction calculation:
- 230lm/W: 35% energy savings = 180 tons CO₂ over 15 years = 5 points
- 150lm/W: Baseline = 3 points
- Advantage: 230lm/W +2 points
Final Tender Score:
Technical Specifications
40
24
+16
Price (initial)
27.5
30
-2.5
Warranty & Support
10
7
+3
Result: 230lm/W wins decisively despite 9% higher initial cost.
Source: European Commission Public Procurement Guidance, "Green Public Procurement Criteria for Road Lighting," 2024
The Technical Advantage: Why Efficiency Translates to Better Proposals
1. Smaller System Footprint
Physical Benefits:
- 35% lighter pole load (smaller battery + panel)
- Reduced wind resistance (smaller solar panel)
- Lower transportation costs (more units per shipment)
- Easier installation (lighter components)
Real Example:A 150lm/W all-in-one system weighs ~28kg
A 230lm/W system weighs ~19kg
Difference: 32% weight reduction
Impact on 500-unit project:
- Crane rental reduced from 8 days to 5 days: Save $4,500
- Installation labor reduced by 150 hours: Save $6,750
- Shipping costs reduced by 2 containers: Save $7,000
- Total savings: $18,250
2. Extended Autonomy Options
With lower power consumption, you can offer better resilience for the same battery size:
Tender Advantage:When tenders require "minimum 3 days autonomy," 230lm/W systems can offer 5+ days for the same cost, providing:
- Better weather resilience
- Higher reliability scores
- Competitive differentiation
Source: Solar Battery Sizing Calculations, Solar Energy International (SEI), 2024
3. Superior Performance in Challenging Climates
Hot Climate Advantage:
LEDs lose efficiency at high temperatures. The formula:Efficiency loss = 0.3-0.5% per °C above 25°C
In 45°C ambient (Middle East summer):
- Temperature differential: 20°C
- Efficiency loss: 6-10%
Impact:
- 150lm/W system drops to: 135-141 lm/W (below tender minimums)
- 230lm/W system drops to: 207-218 lm/W (still premium tier)
High-efficiency LEDs have better thermal management:
- Lower power = less heat generation
- Better quality heat sinks (premium systems)
- Lower junction temperatures
- Longer lifespan
Cold Climate Advantage:
Battery performance degrades in cold weather:
- At 0°C: 80% capacity
- At -10°C: 65% capacity
- At -20°C: 50% capacity
Example: -15°C Winter Night
150lm/W System:
- Nominal consumption: 26.7W × 12h = 320Wh
- Battery at 60% capacity: Designed 480Wh → Available 288Wh
- Result: System shuts down after ~10.8 hours (fails to meet 12-hour requirement)
230lm/W System:
- Nominal consumption: 17.4W × 12h = 209Wh
- Battery at 60% capacity: Designed 314Wh → Available 188Wh
- Result: System operates full 12+ hours
Tender implication: In cold-climate regions, 150lm/W systems require oversized batteries (+40% capacity) to maintain performance, erasing any cost advantage.
Source: Battery Performance in Cold Weather, Sandia National Laboratories, 2023
4. Future-Proof Compliance
Efficiency standards are tightening globally:
European Union
160 lm/W
190 lm/W
210 lm/W
United States (DLC)
170 lm/W
195 lm/W
215 lm/W
China (GB Standards)
150 lm/W
180 lm/W
200 lm/W
Middle East (ESMA)
140 lm/W
170 lm/W
190 lm/W
Source: International Energy Agency (IEA), "Global Lighting Efficiency Standards Tracker," 2024
Procurement Impact:Municipalities planning 10-15 year deployments increasingly require systems that will remain compliant throughout the lifespan.
150lm/W systems risk:
- Early obsolescence
- Difficulty sourcing replacement parts
- Reduced resale value
- Failed audits in later years
230lm/W systems:
- Exceed 2028 targets today
- Future-compliant
- Better long-term support
- Higher residual value
Case Studies: Real Tenders Won With Efficiency
Case Study 1: Mediterranean Coastal City (Spain)
Project Details:
- Scope: 1,850 solar street lights, seafront promenade and inland streets
- Budget: €2.4 million
- Evaluation period: 12 years
- Key challenge: High corrosion environment + tourist area (aesthetics matter)
The Competition:
- 7 bidders prequalified
- Price range: €2.1M - €2.8M
- Our bid: €2.45M (middle tier)
Our Technical Approach:
- LED Efficiency: 230 lm/W (vs. competitors' 140-180 lm/W)
- System design: Smaller, sleeker fixtures (tourist area aesthetic requirement)
- Battery: Grade-A LiFePO4, marine-grade coating
- Panel: 35% smaller (reduced wind load, better aesthetics)
Scoring Results:
Key Winning Factor:The evaluation committee's report stated: "While not the lowest initial cost, Gillson's 230lm/W solution offers 28% lower lifecycle costs, superior aesthetic integration due to compact design, and energy savings equivalent to removing 340 cars from roads annually."
Post-Installation (18 months):
- 0.4% failure rate (vs. 3-7% industry average)
- Municipality expanded order by 600 additional units
- Won regional government supply framework contract
- Total contract value growth: €2.45M → €3.8M
Case Study 2: Middle Eastern Smart City Development (UAE)
Project Details:
- Scope: 3,200 LED street lights + IoT integration
- Budget: $5.2 million
- Evaluation period: 15 years
- Extreme requirements: 50°C summer temperatures, sandstorm resilience
The Challenge:This was a design-build-operate tender with performance guarantees:
- Minimum 98% uptime
- Maximum 2% annual maintenance visits
- Penalties for failures: $500/light/month downtime
Why 150lm/W Systems Would Fail:
Thermal Stress Analysis:
- Ambient: 50°C
- Solar heat gain on fixture: +15°C
- Internal heat (150lm/W, 30W): +35°C
- Junction temperature: 100°C+ (approaching failure threshold)
At these temperatures:
- LED lifespan drops 70%
- Driver failure rates triple
- Battery cycling stress increases
Insurance companies refused to underwrite 150lm/W systems for this climate at reasonable premiums.
Our 230lm/W Solution:
- Lower power (17.4W vs. 26.7W) = 30% less heat generation
- Premium thermal management: Oversized heat sinks
- Junction temperature: 78-82°C (safe zone)
- Battery downsizing allowed for better thermal enclosure
Financial Model:
Insurance premium (15yr)
$420K
$180K
Projected failures (15yr)
18% (576 lights)
4% (128 lights)
Replacement costs
$1.2M
$280K
Downtime penalties (est.)
$680K
$150K
Total 15-year cost
$7.1M
$5.81M
Result:
- Won tender with technical score: 98/100 (highest ever in emirate's history)
- Our next-closest competitor: 87/100
- Our price was 8% higher, but NPV was 18% lower
Performance After 24 Months:
- 99.6% uptime (exceeds 98% requirement)
- 1.2% maintenance visits (under 2% limit)
- Zero downtime penalties
- Client testimonial became centerpiece for 4 subsequent tender wins
Case Study 3: Sub-Saharan Africa Rural Electrification (Kenya)
Project Details:
- Scope: 1,200 solar lights across 40 villages
- Budget: $980,000 (donor-funded: World Bank)
- Extreme constraint: Must use local installation labor (limited technical training)
Unique Tender Requirement:"System must be maintainable by village technicians with maximum 2 days training."
The Efficiency Angle:
150lm/W System Complexity:
- Larger batteries (112Ah) = heavy, difficult handling
- 133W solar panels = requires 2-person installation
- Complex wiring (higher currents)
- Frequent maintenance due to component stress
230lm/W System Simplification:
- Smaller batteries (74Ah) = one-person carry
- 87W panels = one-person installation
- Simpler wiring (lower currents, safer)
- All-in-one design = fewer connection points
Training Impact:
- 150lm/W system: 5 days minimum training for safe installation
- 230lm/W system: 2 days training (met tender requirement)
Cost Analysis:
Equipment
$875,000
$920,000
+$45,000
Installation time
90 days
60 days
-30 days
Training costs
$28,000
$12,000
-$16,000
Installation errors (rework)
$35,000 (est.)
$8,000
-$27,000
Total project cost
$938,000
$940,000
+$2,000
Scoring:
- Technical simplicity: 18/20 vs. 12/20 (competitors)
- Training requirement: 10/10 vs. 5/10
- Local capacity building: 10/10 vs. 6/10
- Total: 94/100 vs. 78/100 (nearest competitor)
Impact After 12 Months:
- Village technicians successfully maintained systems (98.7% uptime)
- Zero expatriate technician visits required (saved $45,000 in Year 1)
- Model replicated in 3 neighboring countries
- Follow-on contracts: $2.8M over 3 years
The Technical Proposal Strategy: Winning With Efficiency
How to Structure Your Tender Response
Section 1: Executive Summary (Lead With TCO)
DON'T write:"We propose 500 solar street lights with 230lm/W efficiency..."
DO write:"Our solution delivers €124,000 in lifecycle savings over 10 years through 35% superior energy efficiency, reducing the municipality's long-term financial burden while exceeding all technical requirements."
Put the financial benefit first.
Section 2: Technical Specifications (Quantify Everything)
Create a comparison table:
Luminous Efficacy
≥160 lm/W
230 lm/W
+44%
Power Consumption
≤30W
17.4W
-42%
Battery Capacity
≥60Ah
74Ah
+23%
Autonomy
≥3 days
5.2 days
+73%
IP Rating
≥IP65
IP66
Exceeds
Show how you exceed requirements, don't just meet them.
Section 3: Financial Analysis (The Winning Section)
Include:
3.1 Initial Cost Breakdown
- Transparent component costs
- Manufacturing
- Shipping & logistics
- Installation
- Training
- Total
3.2 Annual Operating Costs (Years 1-10)
- Maintenance schedule and costs
- Replacement parts projection
- Energy savings (if grid-tied reference)
- Labor requirements
3.3 Net Present Value Analysis
- Show total 10-15 year costs
- Use municipality's discount rate (usually 3-5%)
- Highlight lifecycle savings
3.4 Risk Analysis
- Failure rate projections (with data sources)
- Warranty coverage
- Replacement cost scenarios
- Insurance implications
Section 4: Environmental Impact (Often Worth 5-10 Points)
Quantify carbon savings:
Formula:
- Power saved per light: (150lm/W consumption - 230lm/W consumption) × hours/year
- Total kWh saved: Power saved × number of lights
- CO₂ avoided: kWh × grid carbon intensity factor
Example (500 lights):
- Power saved: (26.7W - 17.4W) = 9.3W per light
- Hours per year: 12 hours × 365 = 4,380 hours
- Total kWh saved: 9.3W × 500 × 4,380h = 20,367 kWh/year
- CO₂ avoided (0.5 kg/kWh grid factor): 10.2 tons/year
- Over 10 years: 102 tons CO₂
Equivalent to:
- 230,000 km of car driving avoided
- 11,700 tree seedlings grown for 10 years
- 25 homes' electricity use for 1 year
Source: EPA Greenhouse Gas Equivalencies Calculator
Section 5: Risk Mitigation (Critical for High-Stakes Tenders)
Address common concerns:
"Higher efficiency components are newer and unproven"
- Counter: Provide 5+ year field performance data
- Show installations in similar climates
- Include accelerated aging test results (LM-80)
- Reference installations: 85,000+ units across 60+ countries
"Premium systems cost more upfront"
- Counter: NPV analysis showing break-even in Year 1-2
- Demonstrate lower total cost of ownership
- Show reduced financing costs (smaller loan needed over lifecycle)
"What if efficiency claims are exaggerated?"
- Counter: Include third-party test certificates (TUV, UL, DLC)
- Offer performance guarantees with penalties
- Provide integrating sphere test reports
- Include lumen maintenance warranty (L70 at 50,000+ hours)
Section 6: Installation & Commissioning Plan
Efficiency advantages during installation:
Lighter Systems = Faster Installation
- Crew size: 2 workers vs. 3 workers (150lm/W systems)
- Installation time: 35 minutes vs. 50 minutes per light
- Equipment: Standard lift vs. heavy-duty crane
Cost Impact (500-unit project):
- Labor savings: 375 hours = $16,875
- Equipment rental savings: 5 days = $4,500
- Schedule acceleration: 15 days faster = earlier completion bonuses
Section 7: Warranty & Support (Often Overlooked)
Higher efficiency enables better warranties:
Why we can offer 5-year comprehensive warranty:
- Lower component stress = fewer failures
- Premium components = longer lifespan
- Lower power = cooler operation = extended LED life
- Statistical failure rate <2% (vs. industry average 8-12%)
Warranty cost structure:
- 150lm/W system: 10% failure rate × $450 replacement = $22,500 warranty reserve needed
- 230lm/W system: 2% failure rate × $450 replacement = $4,500 warranty reserve needed
This allows us to offer:
- Longer warranty periods
- Comprehensive coverage (not just components)
- Faster response times (we can afford it)
- Free preventive maintenance
Interactive ROI Calculator: Your Project Numbers
Input Variables (Customize for Your Tender)
Project Parameters:
- Number of lights: ___________
- Operating hours per night: ___________
- Required illumination (lumens): ___________
- Project lifespan (years): ___________
- Average sun hours per day: ___________
Cost Factors:
- Installation labor rate ($/hour): ___________
- Maintenance labor rate ($/hour): ___________
- Electricity reference cost ($/kWh): ___________
- Discount rate for NPV (%): ___________
Climate Factors:
- Average ambient temperature (°C): ___________
- Required autonomy (days): ___________
- Extreme weather events (days/year): ___________
Calculation Methodology
Step 1: Power Requirement
150 lm/W System:
- Power needed (W) = Required lumens ÷ 150
- Daily energy (Wh) = Power × Operating hours
- Annual energy (kWh) = Daily energy × 365 ÷ 1,000
230 lm/W System:
- Power needed (W) = Required lumens ÷ 230
- Daily energy (Wh) = Power × Operating hours
- Annual energy (kWh) = Daily energy × 365 ÷ 1,000
Energy savings = (150lm/W annual energy - 230lm/W annual energy) × Units
Step 2: Component Sizing
Battery Capacity Required:
Formula:
Battery (Ah) = (Daily energy × Autonomy days × 1.45) ÷ System voltage
1.45 factor accounts for DoD protection (1.2) + losses/aging (1.25)
Solar Panel Required:
Formula:
Panel (W) = (Daily energy × 1.25) ÷ Average sun hours
1.25 factor accounts for losses and charging efficiency
Step 3: Initial Cost Calculation
LED system
Higher wattage × $0.65/W
Lower wattage × $0.85/W
Power × $/W rate
Battery
Capacity × $1.29/Ah
Capacity × $1.29/Ah
Ah × cost/Ah
Solar panel
Wattage × $0.71/W
Wattage × $0.71/W
Panel W × $/W
Controller
$25/unit
$25/unit
Fixed
Housing
$45/unit
$42/unit
Lower due to smaller size
Installation
$85/unit
$85/unit
Fixed per unit
Total initial investment = Sum of all components × Units
Step 4: Operating Costs (Annual)
Maintenance:
- Cleaning & inspection: Units × $13.50/year
- Driver replacement: Units × Failure rate × $45
- Controller updates: $800 + (Units ÷ 100) × $50
Failure rate assumptions:
- 150 lm/W: Year 1-3: 5%, Year 4-6: 8%, Year 7+: 12%
- 230 lm/W: Year 1-3: 2%, Year 4-6: 3%, Year 7+: 4%
Step 5: Replacement Costs
Battery replacement (typically Year 5 and Year 10):
- 150 lm/W: Capacity × $1.29/Ah × Units + Labor ($35/unit)
- 230 lm/W: Capacity × $1.29/Ah × Units + Labor ($35/unit)
LED/Driver major refurbishment (Year 8-10):
- 150 lm/W: 15% of units × $120/unit
- 230 lm/W: 5% of units × $120/unit
Step 6: Net Present Value Calculation
Formula:
NPV = Σ [Cost in Year N ÷ (1 + discount rate)^N]
For each year (0-10):
- Year 0: Initial investment
- Years 1-10: Operating costs
- Year 5, 10: Battery replacement
- Year 10: Decommissioning
Total NPV = Sum of all discounted costs
Common Objections & Responses
Objection 1: "230lm/W systems are too expensive"
Response:"The initial component cost is actually 21% lower due to smaller batteries and solar panels. When adding lifecycle costs, the 10-year NPV is 24% less expensive. You're not paying more—you're paying less both upfront and long-term."
Supporting data:
- Show component cost breakdown
- Highlight battery/panel savings
- Present NPV comparison
- Reference successful installations
Objection 2: "We've always used 150lm/W and it works fine"
Response:"That was true 5 years ago when 150lm/W was premium technology. Today's standards have evolved:
- EU minimum efficiency: 160lm/W (current), 190lm/W (2026)
- US DLC Premium: 170lm/W (current), 195lm/W (2026)
- 150lm/W systems are becoming obsolete
Municipalities locked into 150lm/W technology face:
- Difficulty sourcing replacement parts in 3-5 years
- Failed compliance audits
- Higher insurance premiums
- Reduced resale value"
Source: International Energy Agency Efficiency Standards Database, 2024
Objection 3: "Higher efficiency LEDs fail faster due to newer technology"
Response:"This is a common misconception. The data shows the opposite:
Failure rates (industry averages):
- 150 lm/W systems: 8-12% over 5 years
- 230 lm/W systems: 2-4% over 5 years
Why higher efficiency is more reliable:
- Lower heat generation (35% less power = less thermal stress)
- Premium components (manufacturers pair efficient LEDs with quality drivers)
- Better thermal management (advanced heat sink design)
- Lower junction temperatures (directly correlates to longer lifespan)
Physics principle: Every 10°C reduction in junction temperature doubles LED lifespan (Arrhenius equation).
230lm/W LEDs typically run 15-20°C cooler than 150lm/W, resulting in 2-4x longer lifespan."
Source: Illuminating Engineering Society TM-21 Calculator, LED Reliability Research, 2024
Objection 4: "Our budget only allows for the cheapest option"
Response:"Budget constraints are real, but consider the full picture:
Financing options:
- Performance-based contracting: Lower operating costs fund higher upfront investment
- Leasing arrangements: Spread costs over lifecycle
- Energy savings guarantees: Use guaranteed savings to offset upfront costs
- Green bonds/climate financing: Many banks offer favorable rates for high-efficiency infrastructure
Break-even analysis:Most municipalities break even in 12-18 months through:
- Lower maintenance costs
- Reduced truck rolls
- Fewer replacement parts
- Extended warranty coverage
Real example:City of Valencia, Spain financed 230lm/W upgrade through European Investment Bank green facility at 1.8% interest (vs. standard 4.2%). The efficiency premium paid for itself through reduced interest charges alone."
Source: European Investment Bank Municipal Energy Efficiency Financing Programs, 2024
Objection 5: "We need to test samples for 12+ months before committing"
Response:"We absolutely encourage sample testing—it's best practice. However, we can accelerate confidence-building:
Accelerated testing protocol (90 days):
- Weeks 1-2: Performance verification
- Lux measurements
- Charging efficiency
- Battery discharge curves
- Weeks 3-6: Stress testing
- Temperature cycling (-20°C to +60°C)
- Humidity exposure (simulates 1 year)
- Vibration testing
- Weeks 7-12: Accelerated aging
- Continuous operation (24/7 = 2,160 hours ≈ 6 months field use)
- Lumen depreciation monitoring
- Thermal imaging
Plus, we provide:
- Reference installations nearby (visit anytime)
- Performance data from similar climates
- Independent test reports (TUV, UL, SGS)
- Performance guarantee with penalties
Fast-track option:Many clients do parallel deployment:
- Phase 1: 50-100 units (pilot, 3 months monitoring)
- Phase 2: Remaining units (if Phase 1 successful)
This approach achieves full deployment within 6 months while maintaining prudent risk management."
Regional Tender Strategies: Adapting to Local Requirements
European Union Tenders
Key Characteristics:
- Strong emphasis on lifecycle costs (mandatory NPV analysis)
- Environmental compliance weighted heavily (EU Green Deal)
- Circular economy requirements (end-of-life recycling)
- CE marking mandatory
- Often requires local installation partners
Winning strategy:
- Lead with carbon footprint reduction (align with EU climate targets)
- Emphasize energy savings in kWh (EU carbon pricing context)
- Show compliance with Ecodesign Directive
- Highlight recyclability and material sourcing
- Partner with local installers/distributors
Key certifications:
- CE (LVD, EMC, RoHS, WEEE)
- EN 60598 (luminaire safety)
- EN 62471 (photobiological safety)
- EN 13201 (road lighting performance)
Typical scoring:
- Technical: 35-40%
- Price (NPV): 30-35%
- Environmental: 10-15%
- Social (local jobs): 5-10%
- Innovation: 5-10%
Middle East & North Africa Tenders
Key Characteristics:
- Extreme temperature requirements (50°C+ summer)
- Sandstorm resilience critical
- Often fast-track schedules
- Price-sensitive but quality-conscious
- Strong preference for proven track records
Winning strategy:
- Emphasize thermal performance data
- Show installations in similar climates (UAE, Saudi, Egypt)
- Highlight maintenance cost savings (labor expensive in remote areas)
- Demonstrate sandstorm/dust resistance
- Offer fast mobilization capabilities
Key certifications:
- ESMA (UAE)
- SASO (Saudi Arabia)
- EAC (some markets)
- IEC standards compliance
Critical technical specs:
- Junction temperature <85°C at 50°C ambient
- IP66 minimum (sand ingress protection)
- UV-resistant materials
- Corrosion resistance (coastal areas)
Typical tender language:"System must operate reliably at 50°C ambient temperature with sustained performance over 15 years, with maximum 2% annual maintenance requirement."
Why 230lm/W wins:
- Lower heat generation = survival in extreme heat
- Smaller batteries = better thermal management
- Premium components = withstand harsh conditions
- Lower failure rates = meet strict uptime requirements
North America Tenders
Key Characteristics:
- Strong focus on DLC (DesignLights Consortium) compliance
- Buy America Act requirements (some projects)
- Utility rebate eligibility important
- Liability concerns (UL/CSA listing critical)
- Performance guarantees expected
Winning strategy:
- Lead with DLC Premium certification (rebate eligibility)
- Emphasize liability protection (UL listed)
- Show installed base in similar jurisdictions
- Highlight utility incentive compatibility
- Provide comprehensive insurance/bonding
Key certifications:
- UL 1598 or UL 8750 (LED lighting)
- FCC Part 15 (EMI/RFI)
- DLC Premium listing
- CSA (Canada)
- Buy America compliance documentation (if applicable)
Unique considerations:
- Cold weather performance critical (northern states/Canada)
- Hurricane resistance (coastal regions)
- Wildlife protection (dark sky compliance)
Typical scoring:
- Technical compliance: 40%
- Price: 35%
- Experience: 15%
- Local content: 5-10%
Asia-Pacific Tenders
Key Characteristics:
- Rapidly evolving efficiency standards
- Strong emphasis on smart city integration
- Price competitive but quality improving
- IoT/connectivity increasingly required
- Diverse climate requirements
Winning strategy:
- Emphasize smart features (if available)
- Show regional manufacturing/support capability
- Highlight technology transfer potential
- Demonstrate climate adaptability (tropical to temperate)
- Offer training and capacity building
Key certifications:
- Country-specific (PSE Japan, CCC China, etc.)
- IEC standards broadly recognized
- Local test reports often required
Regional variations:
- Japan: Highest quality standards, disaster resilience critical
- China: Domestic content requirements, GB standards
- Southeast Asia: Value-conscious, tropical climate focus
- Australia: Standards similar to EU/US, extreme heat considerations
Sub-Saharan Africa Tenders
Key Characteristics:
- Donor-funded projects common (World Bank, AfDB, bilateral)
- Focus on sustainability and local capacity
- Limited technical infrastructure
- Cost-sensitive but looking beyond lowest price
- Emphasis on maintainability
Winning strategy:
- Simplicity and robustness over complexity
- Training and knowledge transfer programs
- Local partnership/employment content
- Long warranty periods (limited local support)
- Proven performance in harsh conditions
Donor requirements typically include:
- Environmental and social impact assessment
- Local content minimum percentages
- Technology transfer provisions
- Training programs for local technicians
Why 230lm/W excels:
- Simpler installation (lighter, smaller components)
- Lower maintenance (fewer failures)
- Easier training (less complex systems)
- Better autonomy (irregular sunshine patterns)
- Lower lifecycle costs (limited maintenance budgets)
The Gillson Advantage: Purpose-Built for Tender Success
Our 12-Year Track Record
500+ Government Tenders Won:
- Municipal street lighting: 320 projects
- Smart city developments: 87 projects
- Rural electrification: 63 projects
- Industrial parks: 30+ projects
Geographic Diversity:
- Europe: 140 projects
- Middle East & Africa: 180 projects
- Asia-Pacific: 95 projects
- Americas: 85 projects
Average tender success rate: 68% (industry average: 23%)
Source: Internal project database, verified by independent auditor, 2024
What Makes Gillson Different
1. Transparent Technical Documentation
- Every specification backed by third-party test reports
- Component-level traceability
- Open factory audits
- Real-time production updates
2. Comprehensive Tender Support
- Dedicated tender engineering team
- Custom calculations for your specific project
- Site visit support (virtual or in-person)
- Reference project facilitation
- Proposal review and optimization
3. Proven Performance Data
- 85,000+ units installed globally
- Real field failure rates (not projections)
- Climate-specific performance data
- Long-term lumen maintenance records
4. Flexible Commercial Terms
- Performance-based contracts available
- Staged payment options
- Local partnership structures
- Warranty programs tailored to tender requirements
5. Post-Award Excellence
- Dedicated project managers
- Technical support during installation
- Training programs for your teams
- Warranty claim response: <48 hours
- Spare parts availability: 7-day delivery
Real Tender Documents: Before & After Analysis
Case Example: Technical Specification Sheet Optimization
BEFORE (Typical 150lm/W Proposal):
LED Street Light Specifications:
- Power: 30W
- Lumens: 4,500
- Color temperature: 5000K
- IP rating: IP65
- Warranty: 3 years
Evaluation committee response: "Meets minimum requirements. Nothing exceptional. Score: 24/40"
AFTER (Optimized 230lm/W Proposal):
LED Street Light - Advanced Efficiency Solution

Performance Specifications:
- Luminous Output: 4,600 lumens (IES LM-79 verified)
- System Efficacy: 230 lm/W (exceeds tender requirement by 44%)
- Power Consumption: 20W (33% below 30W maximum)
- Color Rendering: CRI >80 (superior visibility and safety)
- Color Temperature: 5000K (neutral white, optimal for streets)

Efficiency Advantages:
- 33% lower power consumption vs. tender baseline
- Enables 5.2 days battery autonomy (vs. 3 day requirement)
- Reduces lifecycle energy costs by €89,000 over 10 years
- CO₂ reduction: 47 tons vs. baseline technology

Quality Certifications:
- IP66 (exceeds IP65 requirement)
- IEC 62722 compliant LED modules
- LM-80 certified: L70 @ 70,000 hours
- UL 1598 / CE compliant

Warranty & Support:
- 5-year comprehensive warranty (vs. 3-year standard)
- <48-hour technical support response
- Local spare parts inventory
- 98.4% uptime guarantee

Environmental Impact:
- Equivalent to removing 11 cars from roads for 10 years
- Recyclable components: 89% by weight
- RoHS compliant (no hazardous materials)
Evaluation committee response: "Exceptional technical solution. Significantly exceeds requirements with quantified benefits. Clear lifecycle value. Score: 38/40"
Industry Data Sources & References
Primary Research Citations
- World Bank - Energy Sector Management Assistance Program (ESMAP)
- "Public Procurement of Energy Efficiency in Street Lighting" (2024)
- "Life-Cycle Cost Analysis Guidelines for Municipal Infrastructure" (2023)
- www.esmap.org
- U.S. Department of Energy - Solid-State Lighting Program
- "LED Efficacy and Performance Standards 2024"
- "LM-79 Testing Procedures"
- "LM-80 Lumen Maintenance Analysis"
- www.energy.gov/eere/ssl
- International Energy Agency (IEA)
- "Global Lighting Efficiency Standards Tracker" (2024)
- "Energy Efficiency in Public Infrastructure" (2024)
- www.iea.org
- Illuminating Engineering Society (IES)
- "TM-21 Calculator for Lumen Maintenance Projection"
- "LED Reliability and Lifetime Studies"
- www.ies.org
- DesignLights Consortium (DLC)
- "DLC Premium Requirements and Technical Specifications"
- "Qualified Products List Database"
- www.designlights.org
- European Commission - Green Public Procurement
- "Green Public Procurement Criteria for Road Lighting" (2024)
- "EU Ecodesign Requirements for Lighting Products"
- ec.europa.eu/environment/gpp
- UN Procurement Division
- "Procurement Practitioner's Handbook"
- "Sustainable Public Procurement Guidelines" (2024)
- www.un.org/depts/ptd
- International Finance Corporation (IFC) - World Bank Group
- "Life Cycle Cost Analysis Methodology" (2023)
- "Municipal Infrastructure Procurement Best Practices"
- www.ifc.org
- EPA - Environmental Protection Agency
- "Greenhouse Gas Equivalencies Calculator"
- "Energy Efficiency Standards for Public Lighting"
- www.epa.gov
- Sandia National Laboratories
- "Battery Performance in Extreme Climates" (2023)
- "Solar Energy Systems Reliability Research"
- www.sandia.gov
- Solar Energy International (SEI)
Industry Standards Referenced
- IES LM-79: Electrical and Photometric Measurements of SSL Products
- IES LM-80: Measuring Lumen Maintenance of LED Light Sources
- IES TM-21: Projecting Long Term Lumen Maintenance of LED Light Sources
- IEC 62722: LED Module Performance Requirements
- EN 60598: Luminaire Safety Standards (Europe)
- EN 13201: Road Lighting Performance Requirements
- UL 1598/8750: Safety Standards for Luminaires (North America)
- ISO 14001: Environmental Management Systems